
Project Details
Application Integration Graph (LeanIX)
With the rapid growth of IT systems, understanding the connections and dependencies between various applications has become crucial for efficient management. This project involves the creation of a comprehensive integration graph in LeanIX, providing valuable insights into application relationships within an organization.
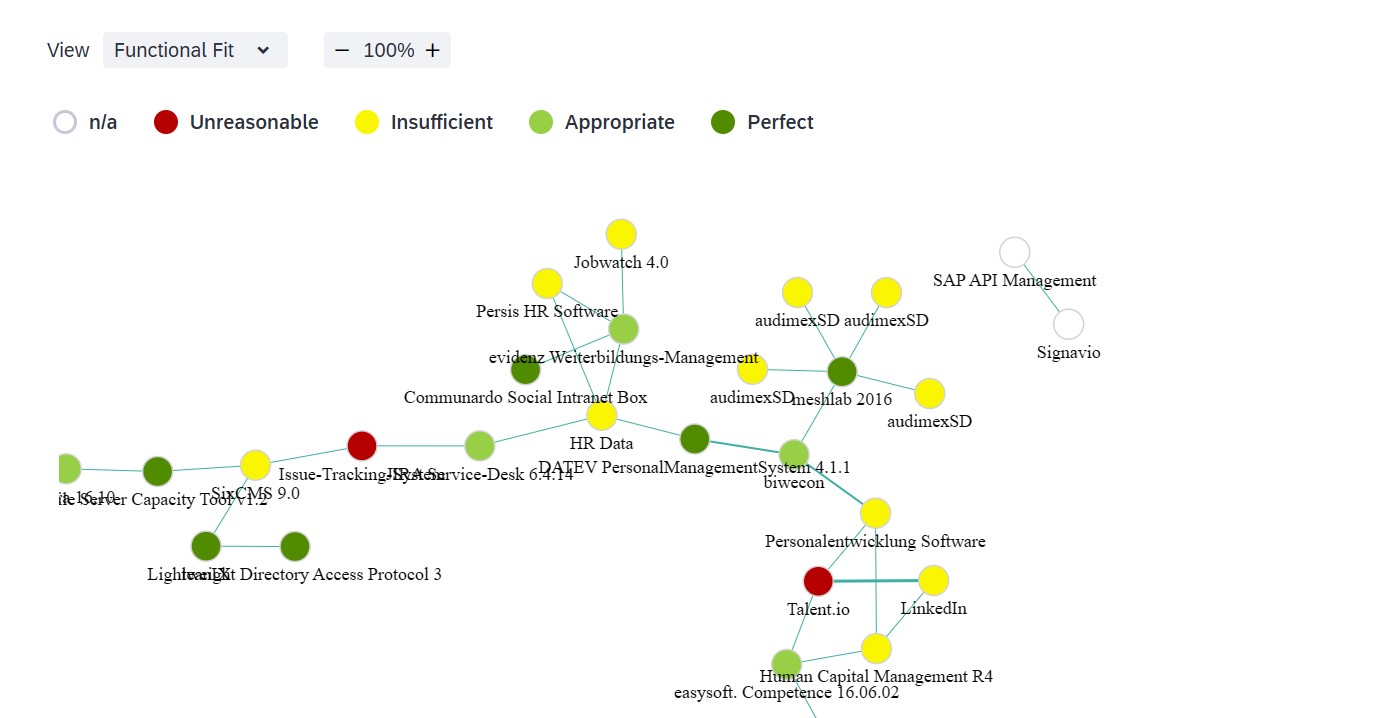
The Application Integration Graph provides a visual representation of interconnected systems within LeanIX, aiding in architecture decision-making, dependency management, and operational efficiency. The project focuses on building an intuitive graph that represents the complex data flows and dependencies among applications.
Key Responsibilities and Contributions:
- Developed a Vue 3 frontend using TypeScript to visualize interdependencies among applications for better architecture management and simplified data relationships.
- Leveraged Django on the backend to build robust APIs, ensuring efficient communication between systems and seamless data flow through GraphQL interfaces.
- Integrated data from multiple sources, utilizing ETL pipelines to ensure the accuracy and real-time synchronization of information.
- Built interactive visualization tools to facilitate the exploration and analysis of complex data relationships, improving both architecture decision-making and proactive risk management.
- Used D3.js for 2D visualization of complex data relationships and Three.js for dynamic 3D representation of system interdependencies and data flows.
- Implemented unit, integration, and end-to-end tests to ensure system stability and functionality, particularly focusing on real-time applications and integration with hardware systems.
Technologies & Tools:
- Frontend: Vue 3, TypeScript, HTML5, CSS/SCSS
- Backend: Node.js, Django, Python
- API: GraphQL, Restful API
- Visualization: D3.js (2D), Three.js (3D), custom interactive tools
- Data Integration: LeanIX API, ETL pipelines
Impact and Future Enhancements:
This graph-based approach to application integration empowers IT departments to make data-driven decisions. Future enhancements could include predictive analytics to forecast system impacts from potential changes in application dependencies.